Prometheus 一款优秀的开源监控告警系统
Prometheus是什么
Prometheus 最开始是由 SoundCloud 开发的开源监控告警系统,是 Google BorgMon 监控系统的开源版本。能很好地与容器平台、云平台配合。
2016年继Kubernetes之后成为第二个正式加入CNCF基金会的项目,随着 Kubernetes 在容器编排领头羊地位的确立,Prometheus 也成为 Kubernetes 容器监控的标配。
设计架构
监控系统的总体架构大多是类似的,都有数据采集、数据处理存储、告警动作触发和告警,以及对监控数据的展示。
下面是 Prometheus 的架构: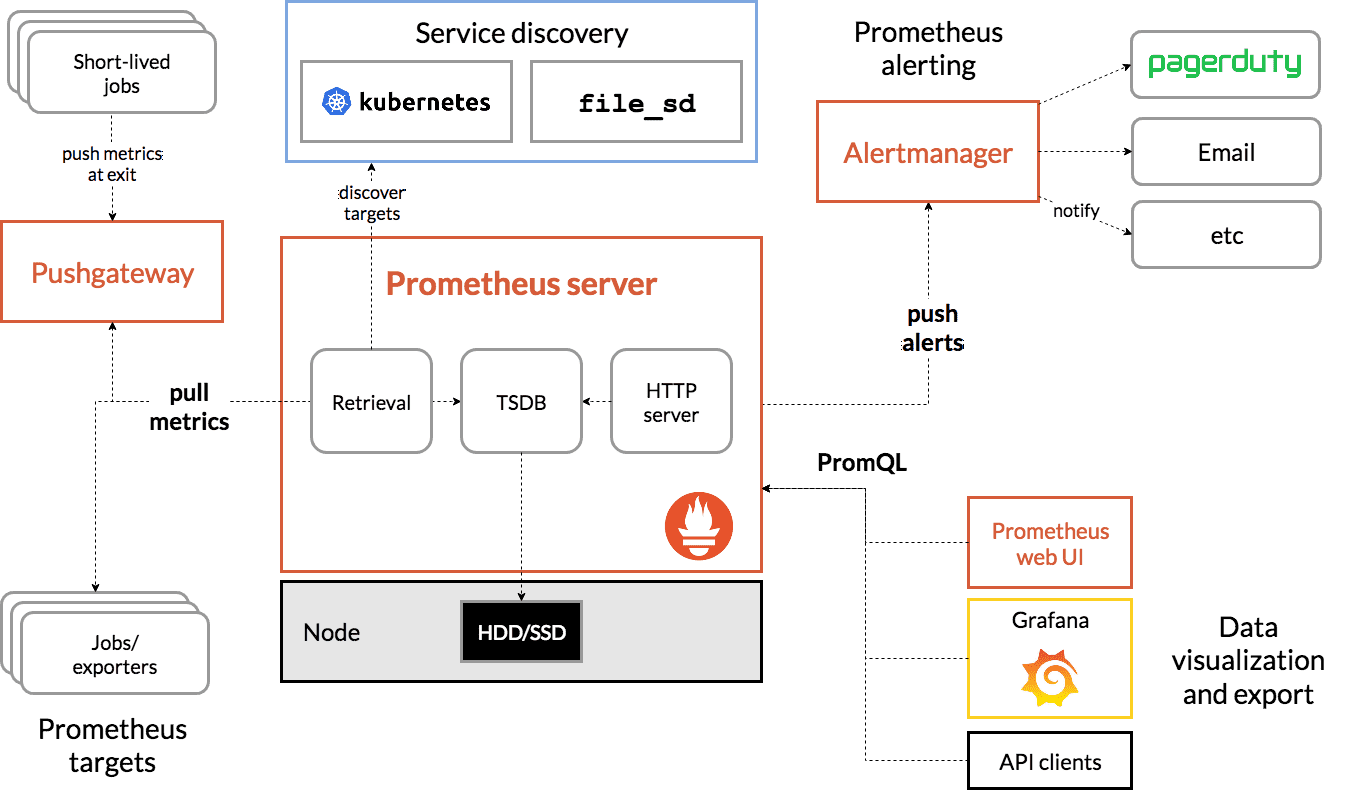
Prometheus Server 负责定时从 Prometheus 采集端 Pull(拉) 监控数据。Prometheus 采集端可以是实现了 /metrics 接口的服务,可以是从第三方服务导出监控数据的 exporter,也可以是存放短生命周期服务监控数据的 Pushgateway。相比大多数采用 Push(推) 监控数据的方式,Pull 使得 Promethues Server 与被采集端的耦合度更低,Prometheus Server 更容易实现水平拓展。
对于采集的监控数据,Prometheus Server 使用内置时序数据库 TSDB 进行存储。同时也会使用这些监控数据进行告警规则的计算,产生的告警将会通过 Prometheus 另一个独立的组件 Alertmanager 进行发送。Alertmanager 提供了十分灵活的告警方式,并且支持高可用部署。
对于采集到的监控数据,可以通过 Prometheus 自身提供的 Web UI 进行查询,也可以使用 Grafana 进行展示。
Prometheus与Influxdb的区别
prometheus是pull模型,influxdb是push模型。
prometheus server启动的时候,你需要告诉它你想它监听哪些节点,每次增加或者减少节点,得重启prometheus server的。
而influxdb则是,每个监控的节点自己配置好influxdb server的地址,向服务端推送数据
对于Prometheus而言,监控节点不需要知道server在哪里,即使server挂了,对监控节点本身无影响
相对的,influxdb server如果挂了,那么所有influxdb 节点发送的请求都会出错
当然,prometheus可以通过push gateway转换成push模型,influxdb可以通过collector转化成pull模型
influxdb的查询语句是类SQL,prometheus则不是
Prometheus 是一套完整的监控系统,包括数据采集、数据处理存储、告警动作触发和告警,以及对监控数据的展示(数据展示很烂,官方都推荐使用Grafana)
influxdb 只是一个数据库
安装Prometheus
Prometheus基于Golang编写,编译后的软件包,不依赖于任何的第三方依赖。用户只需要下载对应平台的二进制包,解压并且添加基本的配置即可正常启动Prometheus Server。Prometheus-GitHub项目
本文直接从官网下载
从二进制包安装和使用Docker安装请查阅Prometheus-GitHub项目
解压,并将Prometheus相关的命令,添加到系统环境变量路径即可
解压后当前目录会包含默认的Prometheus配置文件promethes.yml
➜  prometheus-2.25.2.darwin-amd64 ls
LICENSE           console_libraries prometheus        promtool
NOTICE            consoles          prometheus.yml
Promtheus包含一个时间序列数据库,其采集的数据会以文件的形式存储在本地中,默认的存储路径为data/
用户也可以通过参数--storage.tsdb.path="data/"修改本地数据存储的路径
启动prometheus服务
其会默认加载当前路径下的prometheus.yaml文件:
./prometheus 正常的情况下,你可以看到以下输出内容:
➜  prometheus-2.25.2.darwin-amd64 ./prometheus
level=info ts=2021-03-31T06:06:48.254Z caller=main.go:366 msg="No time or size retention was set so using the default time retention" duration=15d
level=info ts=2021-03-31T06:06:48.254Z caller=main.go:404 msg="Starting Prometheus" version="(version=2.25.2, branch=HEAD, revision=bda05a23ada314a0b9806a362da39b7a1a4e04c3)"
level=info ts=2021-03-31T06:06:48.254Z caller=main.go:409 build_context="(go=go1.15.10, user=root@de38ec01ef10, date=20210316-18:16:26)"
level=info ts=2021-03-31T06:06:48.254Z caller=main.go:410 host_details=(darwin)
level=info ts=2021-03-31T06:06:48.254Z caller=main.go:411 fd_limits="(soft=256, hard=unlimited)"
level=info ts=2021-03-31T06:06:48.254Z caller=main.go:412 vm_limits="(soft=unlimited, hard=unlimited)"
level=info ts=2021-03-31T06:06:48.256Z caller=web.go:532 component=web msg="Start listening for connections" address=0.0.0.0:9090
level=info ts=2021-03-31T06:06:48.256Z caller=main.go:779 msg="Starting TSDB ..."
level=info ts=2021-03-31T06:06:48.258Z caller=tls_config.go:191 component=web msg="TLS is disabled." http2=false
level=info ts=2021-03-31T06:06:48.260Z caller=head.go:668 component=tsdb msg="Replaying on-disk memory mappable chunks if any"
level=info ts=2021-03-31T06:06:48.260Z caller=head.go:682 component=tsdb msg="On-disk memory mappable chunks replay completed" duration=6.222µs
level=info ts=2021-03-31T06:06:48.260Z caller=head.go:688 component=tsdb msg="Replaying WAL, this may take a while"
level=info ts=2021-03-31T06:06:48.260Z caller=head.go:740 component=tsdb msg="WAL segment loaded" segment=0 maxSegment=0
level=info ts=2021-03-31T06:06:48.260Z caller=head.go:745 component=tsdb msg="WAL replay completed" checkpoint_replay_duration=37.072µs wal_replay_duration=250.379µs total_replay_duration=308.367µs
level=info ts=2021-03-31T06:06:48.261Z caller=main.go:799 fs_type=1a
level=info ts=2021-03-31T06:06:48.261Z caller=main.go:802 msg="TSDB started"
level=info ts=2021-03-31T06:06:48.261Z caller=main.go:928 msg="Loading configuration file" filename=prometheus.yml
level=info ts=2021-03-31T06:06:50.775Z caller=main.go:959 msg="Completed loading of configuration file" filename=prometheus.yml totalDuration=2.513709691s remote_storage=4.524µs web_handler=305ns query_engine=721ns scrape=2.513249415s scrape_sd=80.407µs notify=65.766µs notify_sd=46.36µs rules=9.82µs
level=info ts=2021-03-31T06:06:50.775Z caller=main.go:751 msg="Server is ready to receive web requests."
采集数据
若使用Prometheus默认配置文件启动,由于默认配置文件中已经配置了数据采集节点
这一步可以跳过,直接看使用Node Exporter采集主机数据
scrape_configs:
  # The job name is added as a label `job=<job_name>` to any timeseries scraped from this config.
  - job_name: 'prometheus'

    # metrics_path defaults to '/metrics'
    # scheme defaults to 'http'.

    static_configs:
- targets: ['localhost:9090']使用metrics接口获取采集数据
➜  prometheus-2.25.2.darwin-amd64 curl http://localhost:9090/metrics
# HELP go_gc_duration_seconds A summary of the pause duration of garbage collection cycles.
# TYPE go_gc_duration_seconds summary
go_gc_duration_seconds{quantile="0"} 7.5208e-05
go_gc_duration_seconds{quantile="0.25"} 0.000109181
go_gc_duration_seconds{quantile="0.5"} 0.000141038
go_gc_duration_seconds{quantile="0.75"} 0.000168269
go_gc_duration_seconds{quantile="1"} 0.00025607
go_gc_duration_seconds_sum 0.008501346
go_gc_duration_seconds_count 61
# HELP go_goroutines Number of goroutines that currently exist.
# TYPE go_goroutines gauge启动完成后,可以通过http://localhost:9090访问Prometheus的UI界面: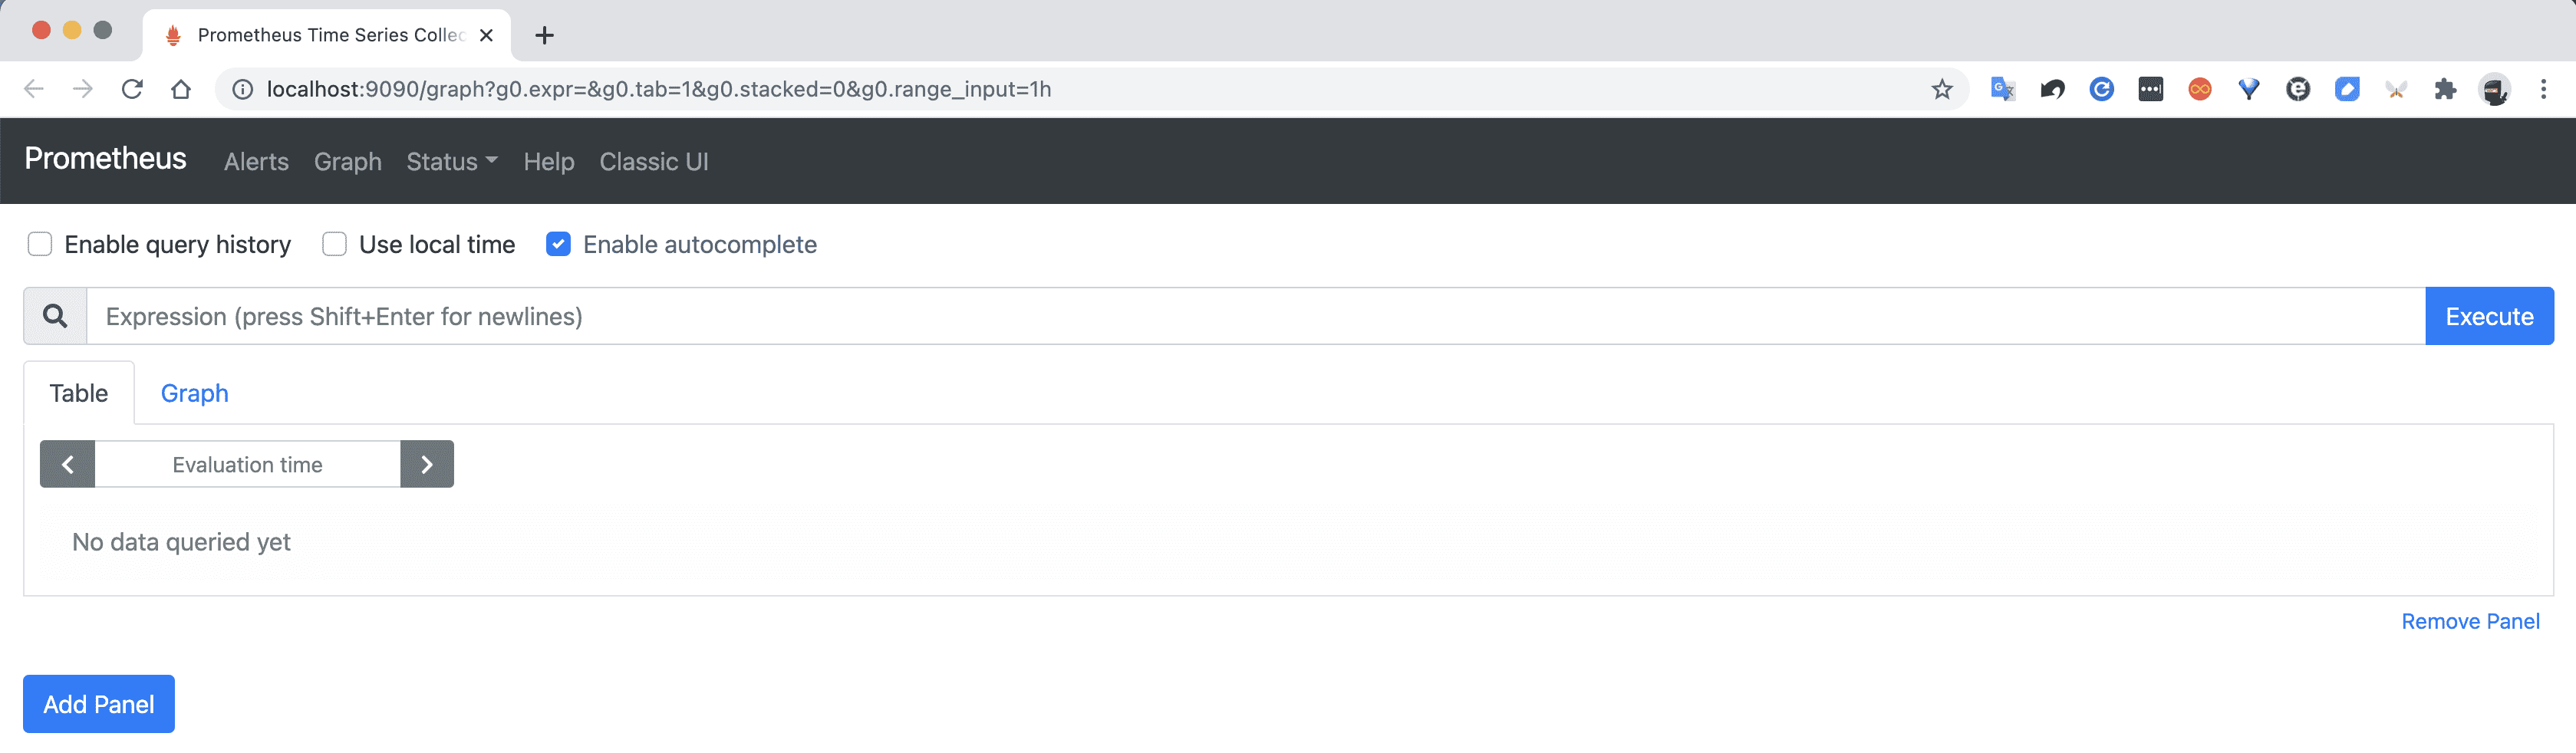
使用Node Exporter采集主机数据
安装Node Exporter
在Prometheus的架构设计中,Prometheus Server并不直接服务监控特定的目标,其主要任务负责数据的收集,存储并且对外提供数据查询支持。因此为了能够能够监控到某些东西,如主机的CPU使用率,我们需要使用到Exporter。Prometheus周期性的从Exporter暴露的HTTP服务地址(通常是/metrics)拉取监控样本数据。
从上面的描述中可以看出Exporter可以是一个相对开放的概念,其可以是一个独立运行的程序独立于监控目标以外,也可以是直接内置在监控目标中。只要能够向Prometheus提供标准格式的监控样本数据即可。
这里为了能够采集到主机的运行指标如CPU, 内存,磁盘等信息。我们可以使用Node Exporter。
Node Exporter同样采用Golang编写,并且不存在任何的第三方依赖,只需要下载,解压即可运行。
本文直接从官网下载
启动Exporter
解压,进入目录执行
➜  node_exporter-1.1.2.darwin-amd64 ls
LICENSE       NOTICE        node_exporter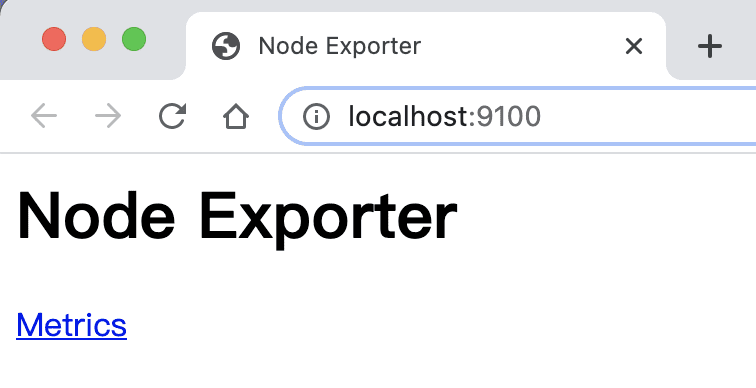
➜ node_exporter-1.1.2.darwin-amd64 ./node_exporter访问http://localhost:9100/可以看到以下页面